
Zenefits:
Compensation Management.
THE BREAKDOWN
Roughly half of existing small-sized businesses don't have a compensation strategy. Zenefits wanted to give companies a salary insights tool with job market data to help admins fairly and conscientiously pay their employees.
MY ROLE
Lead / sole designer — discovery, user research, UX design, visual design, and overseeing development
THE TEAM
Alagirisamy Senthilkumar - Product Manager
Piyush Kunal - Engineering Lead
Marguerite Benedict - Copywriter
Various engineers and data scientists
THE PROBLEM
Admins for small businesses struggle to accurately pay their employees based on their industry, location, and size. If they pay too little, they fail to attract and retain top talent. If they pay too much, they risk overbudgeting for salaries in the long run and having a negative impact on their own bottom line.
OTHER KEY ISSUES
Top tier survey-based compensation management offerings have traditionally been too expensive for a small business to invest in.
Salary data from these offerings is typically skewed towards employees working at larger, more established companies.
Existing salary data providers force a stark tradeoff between data quality and expense: there are large salary data differences between free resources such as LinkedIn and Glassdoor, in comparison to paid resources like PayScale.
FIRST THINGS FIRST: COMPANY SETUP
When a company admin accesses Compensation Management for the first time, they're asked to provide details about their company to more accurately find salary data pertaining to their employees. They give information such as industry, sub-industry, and percentile ranges of salaries.
What sets Zenefits apart with this app is the large set of aggregated data for job salaries we've anonymously collected from our small business customers. Using this curated data, our system attempts to "map" each job within the admin's company to job titles within the Zenefits' collection of data, as well as experience levels. Admins are then asked to fill in any gaps the system wasn't able to recognize. With all data in the settings collected, this translates into targeted salary ranges for each job title, and the admin is taken to their Overview page.
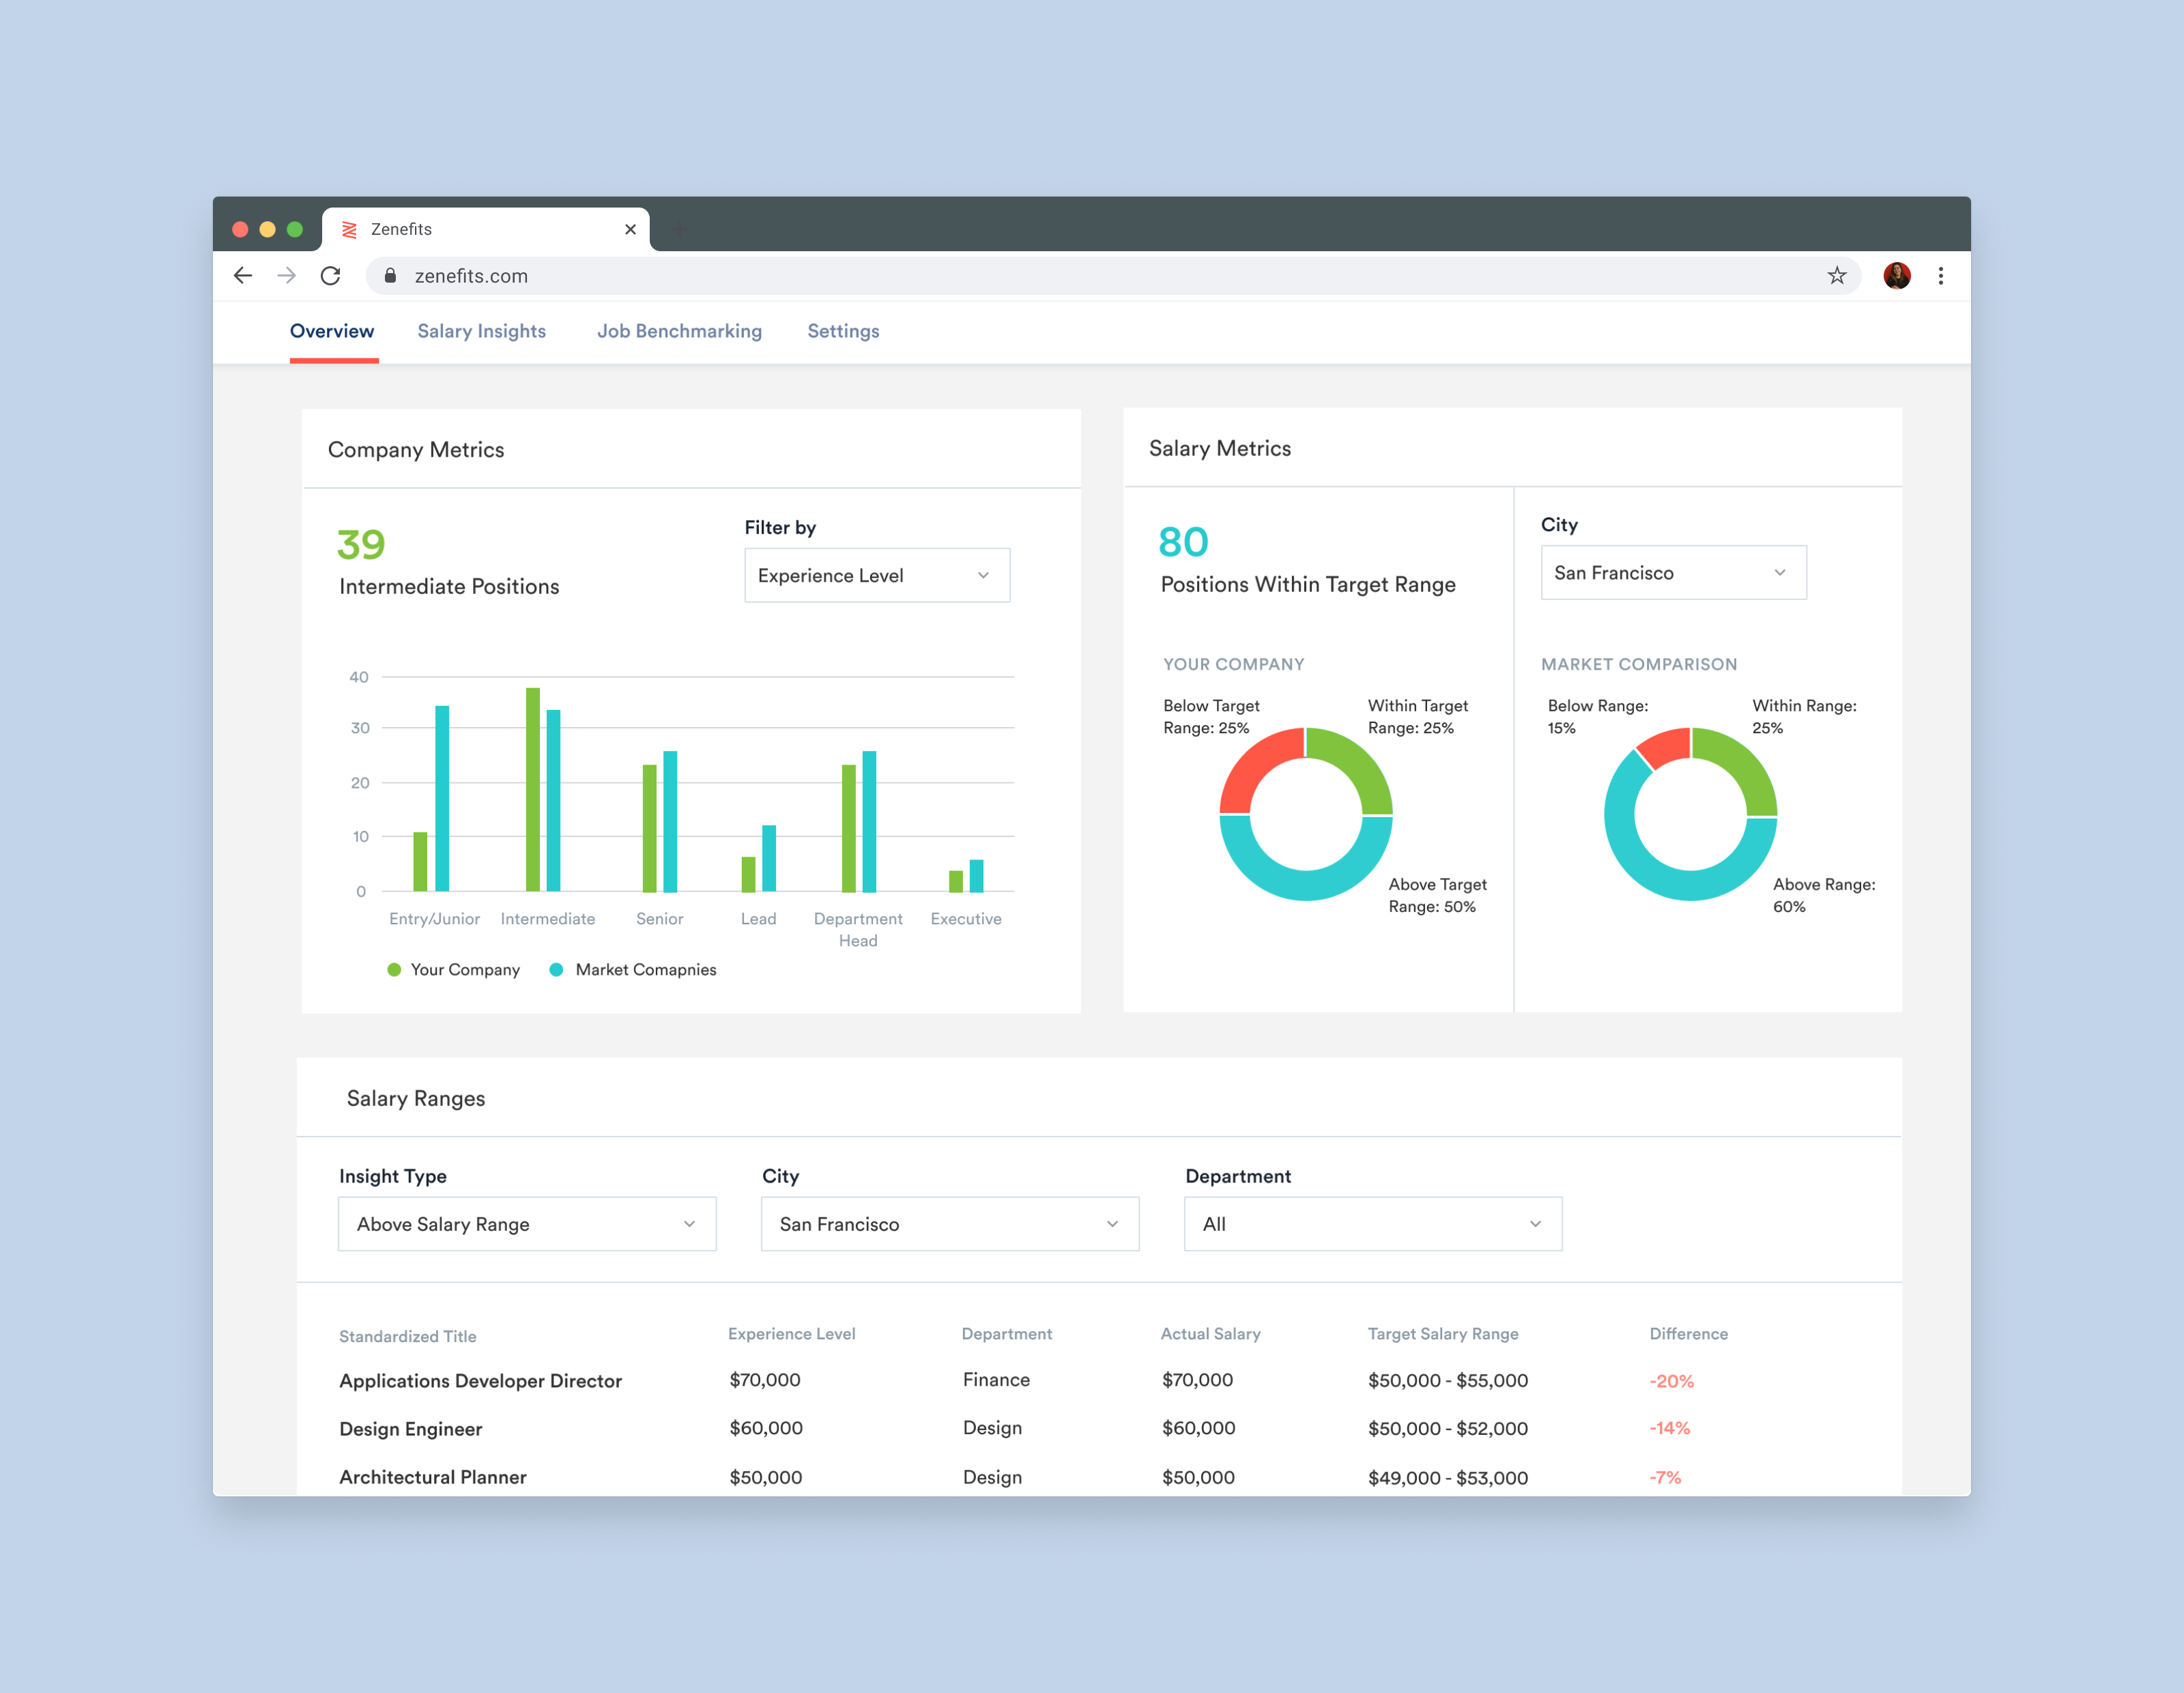
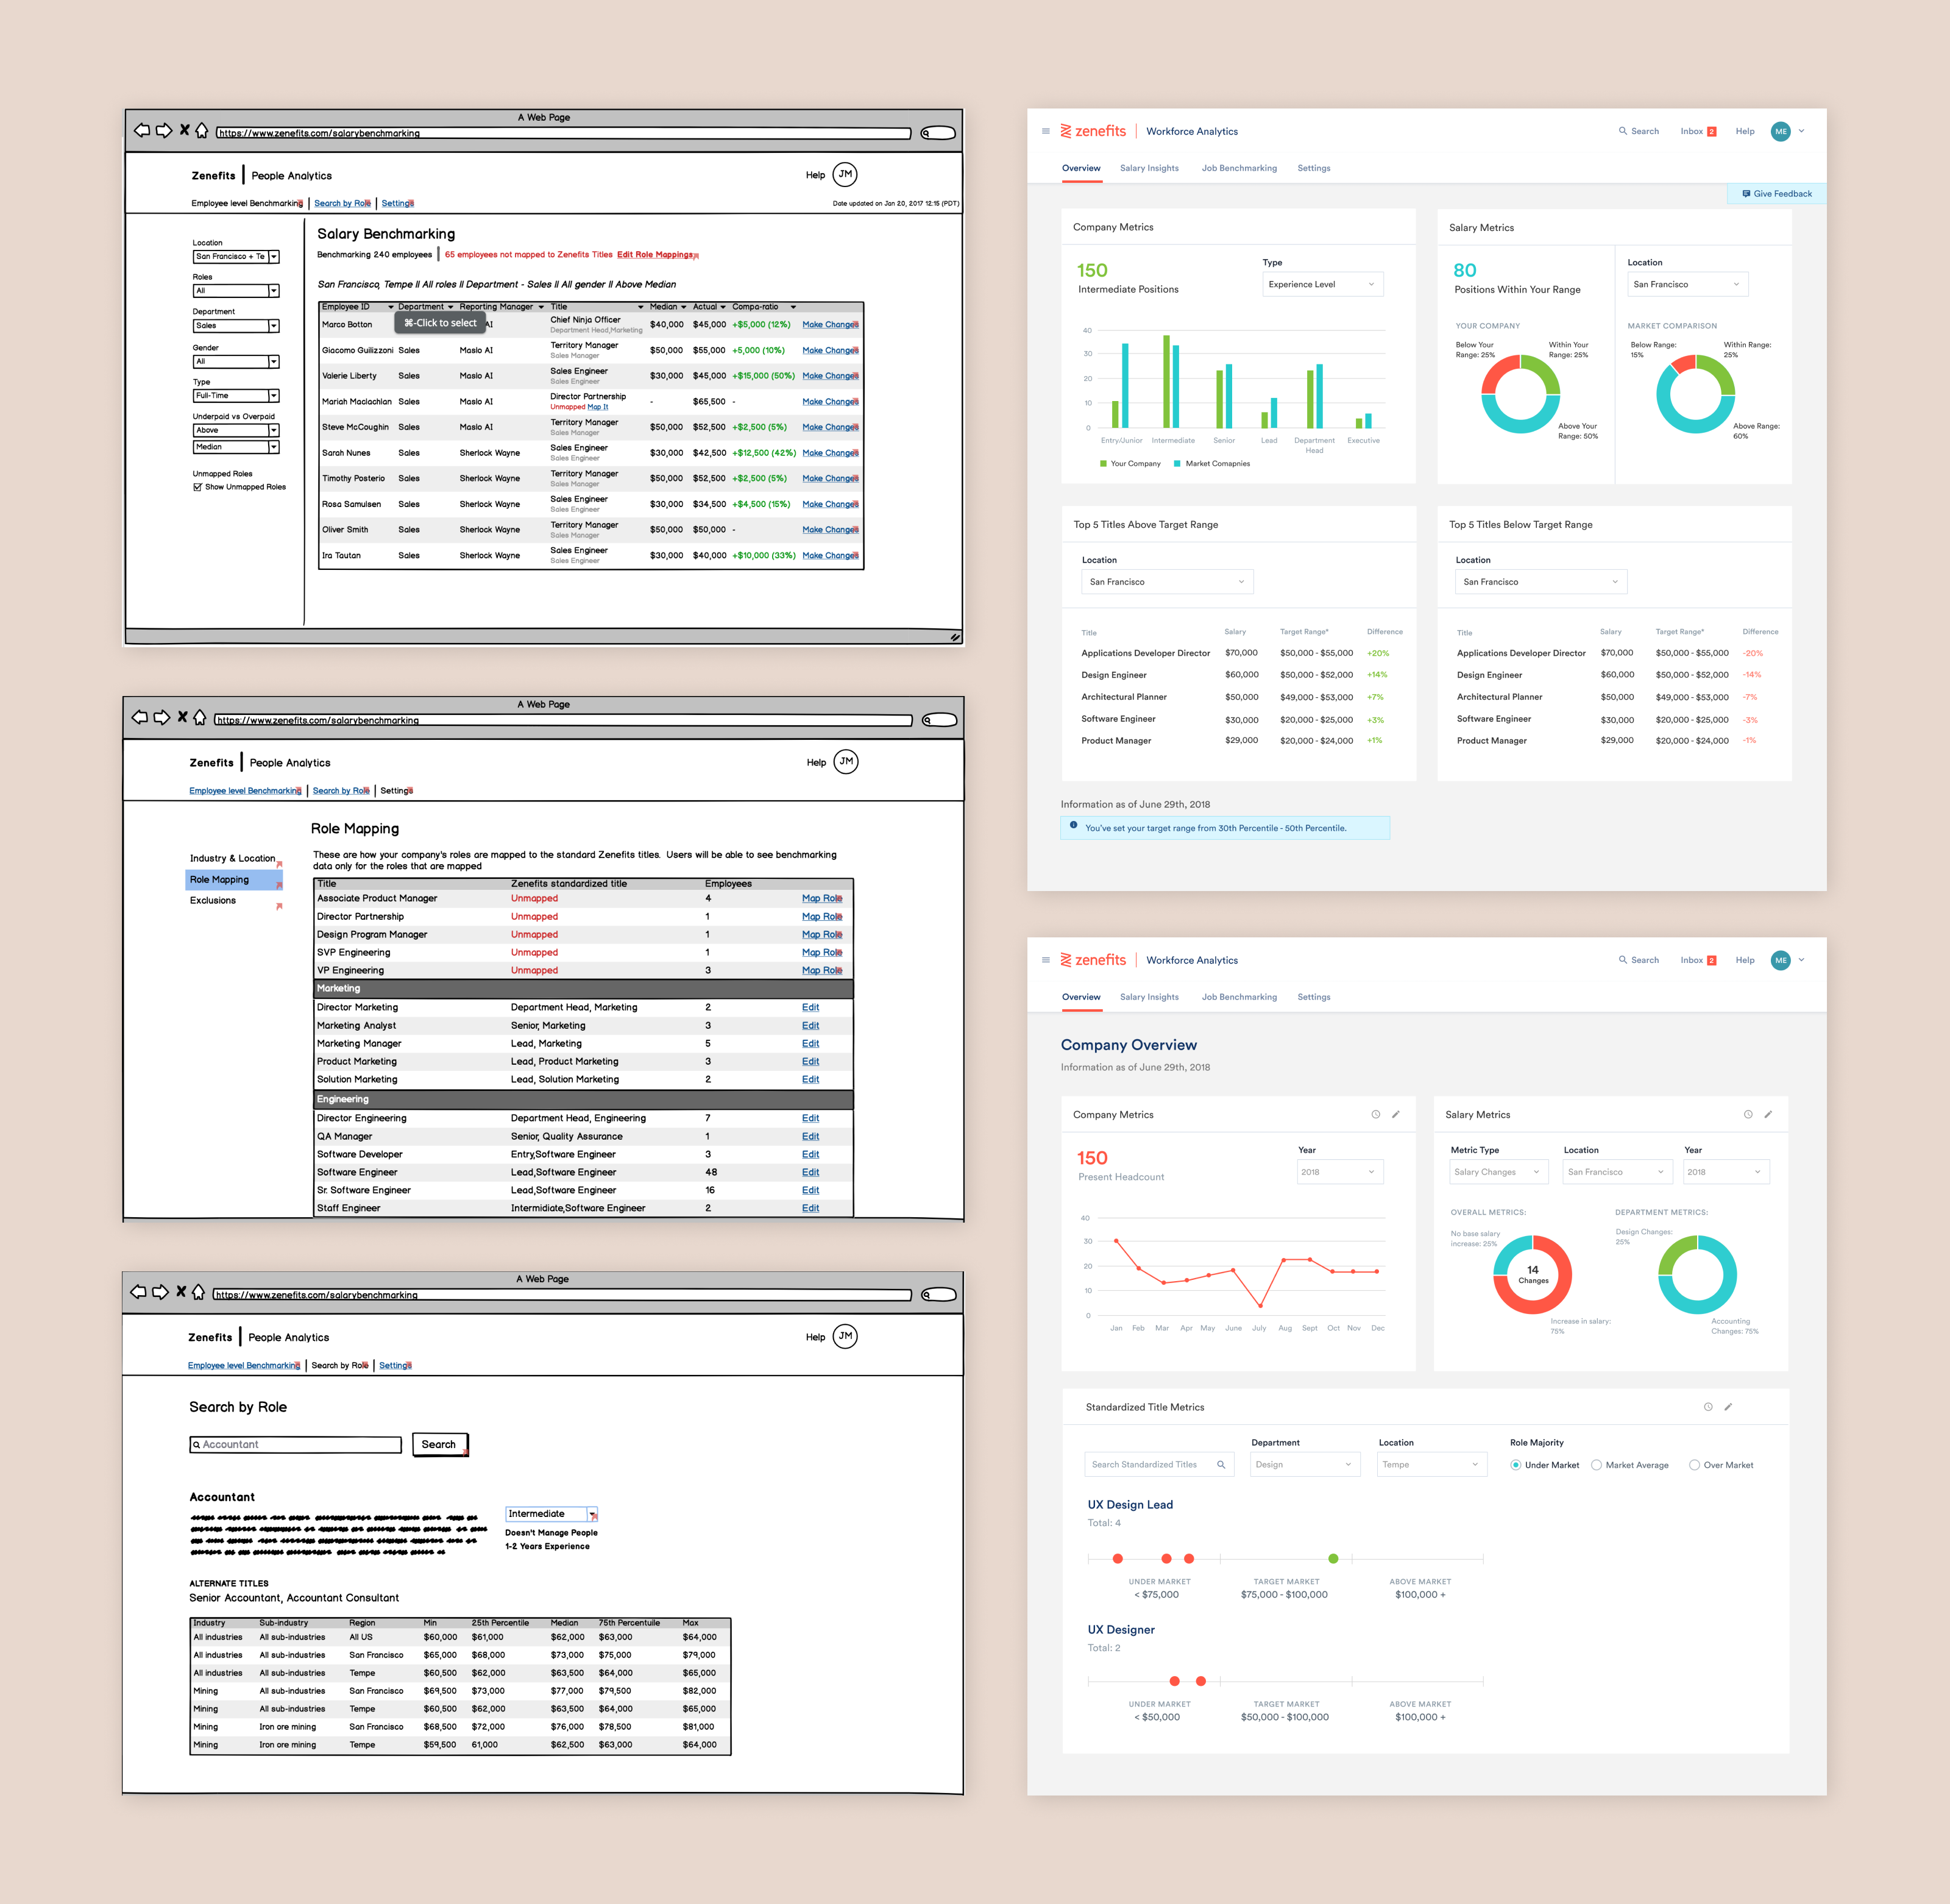
PART 1: OVERVIEW
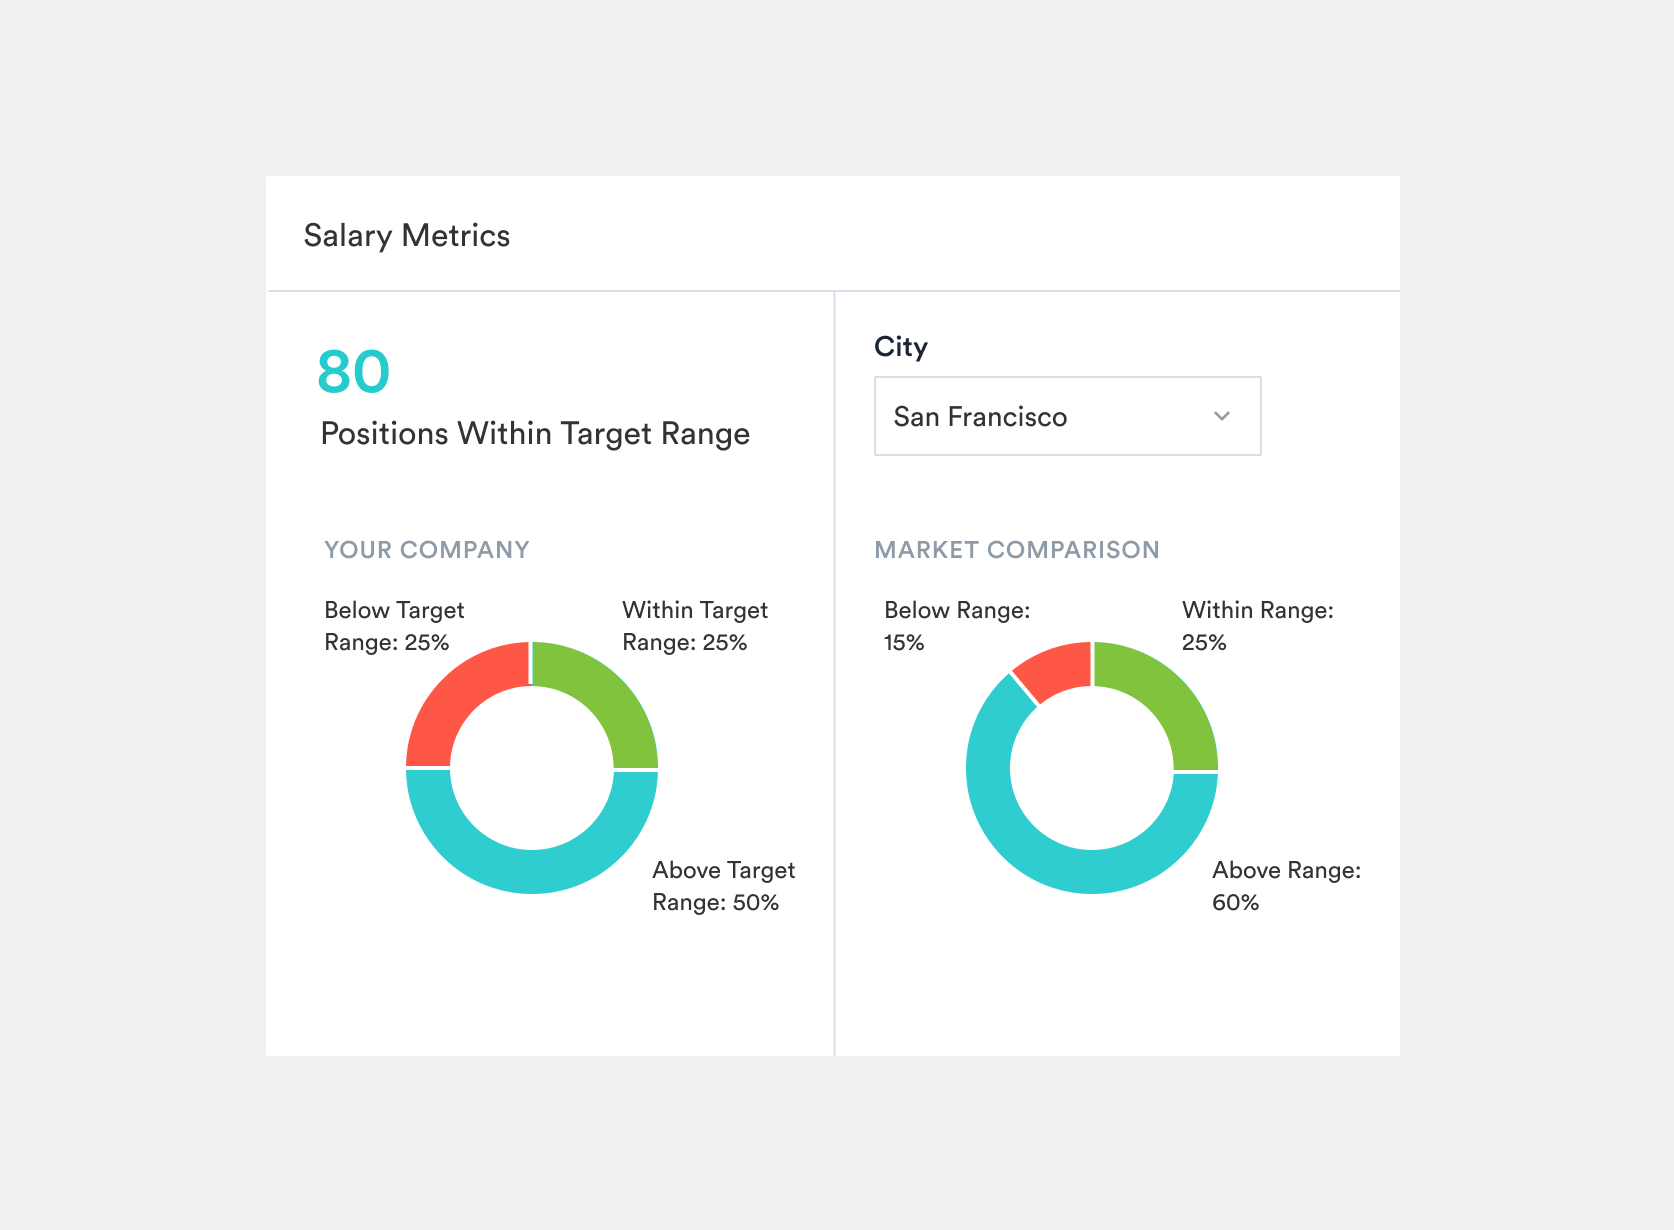
SALARY METRICS
The Overview page includes a section for seeing the distribution of salaries
in your company — whether our system has categorized them as below your targeted salary range, within it, or above it. We allow you to see how these
salaries compare to different cities, which can be useful and eye-opening if
your company is looking to hire in multiple locations.
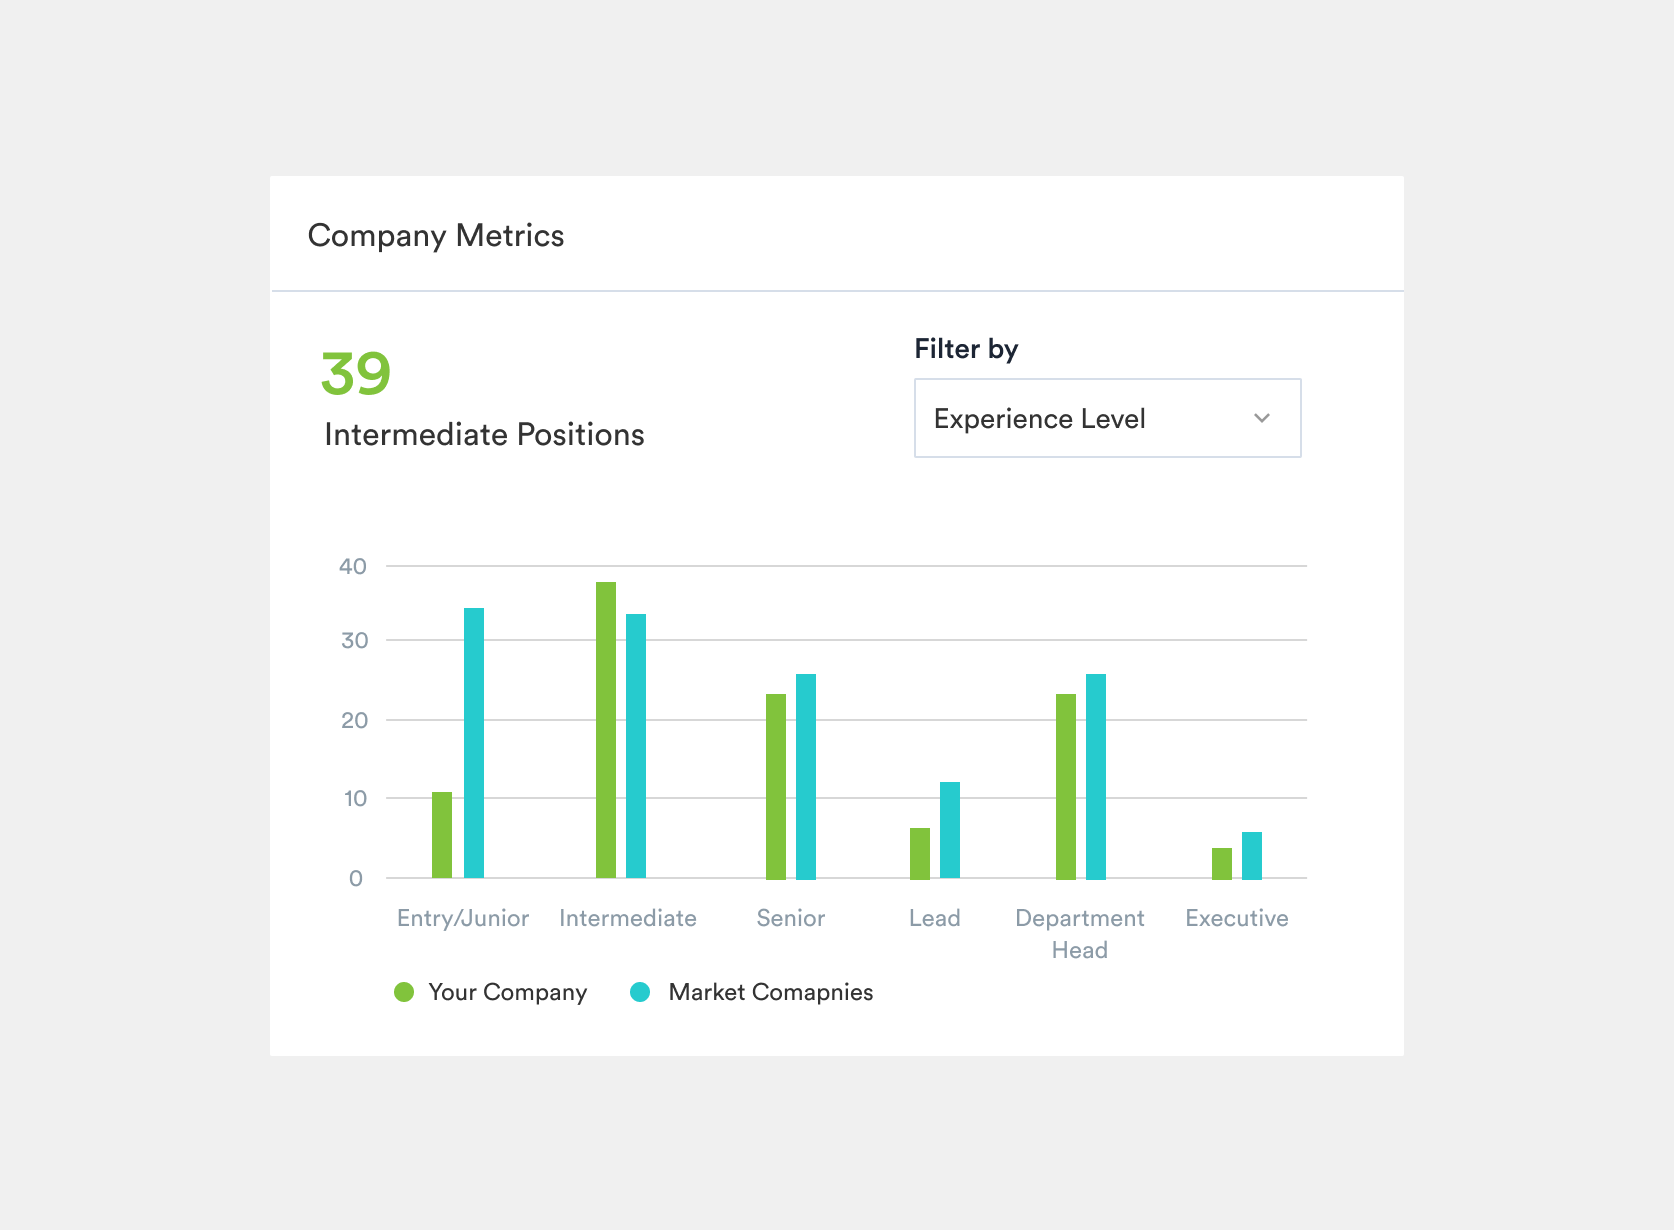
COMPANY METRICS
Admins are able to also view a breakdown of different experience levels in their comapny and how this compares to companies of a similar location and industry. This allows admins to hypothesize if they have too senior of talent causing their overall pay scale to tilt higher.
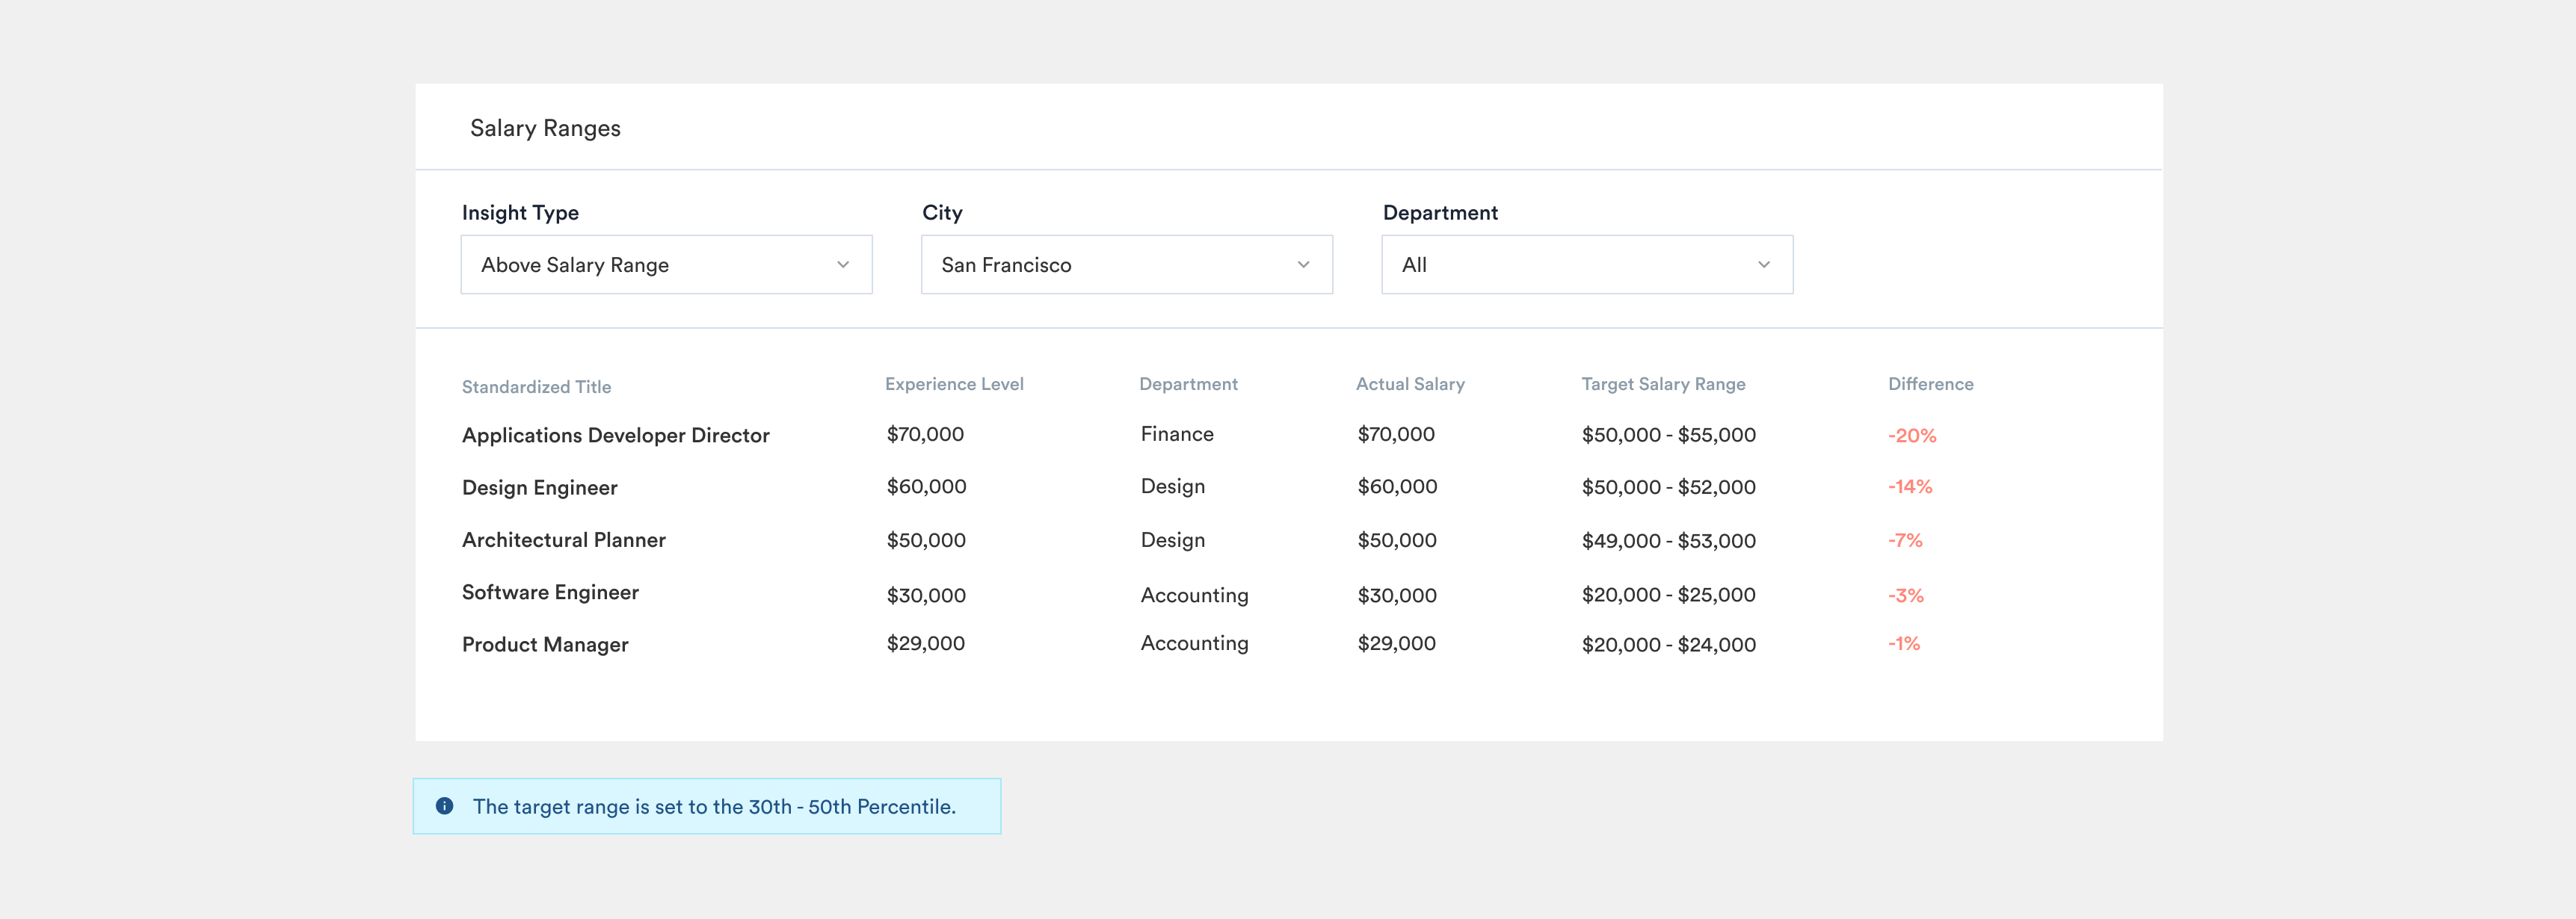
SALARY RANGES
This section allows you to see which job titles in your company are above, below, or within your salary range. It also shows a percentage difference of just how much above or below these salaries are to that range.
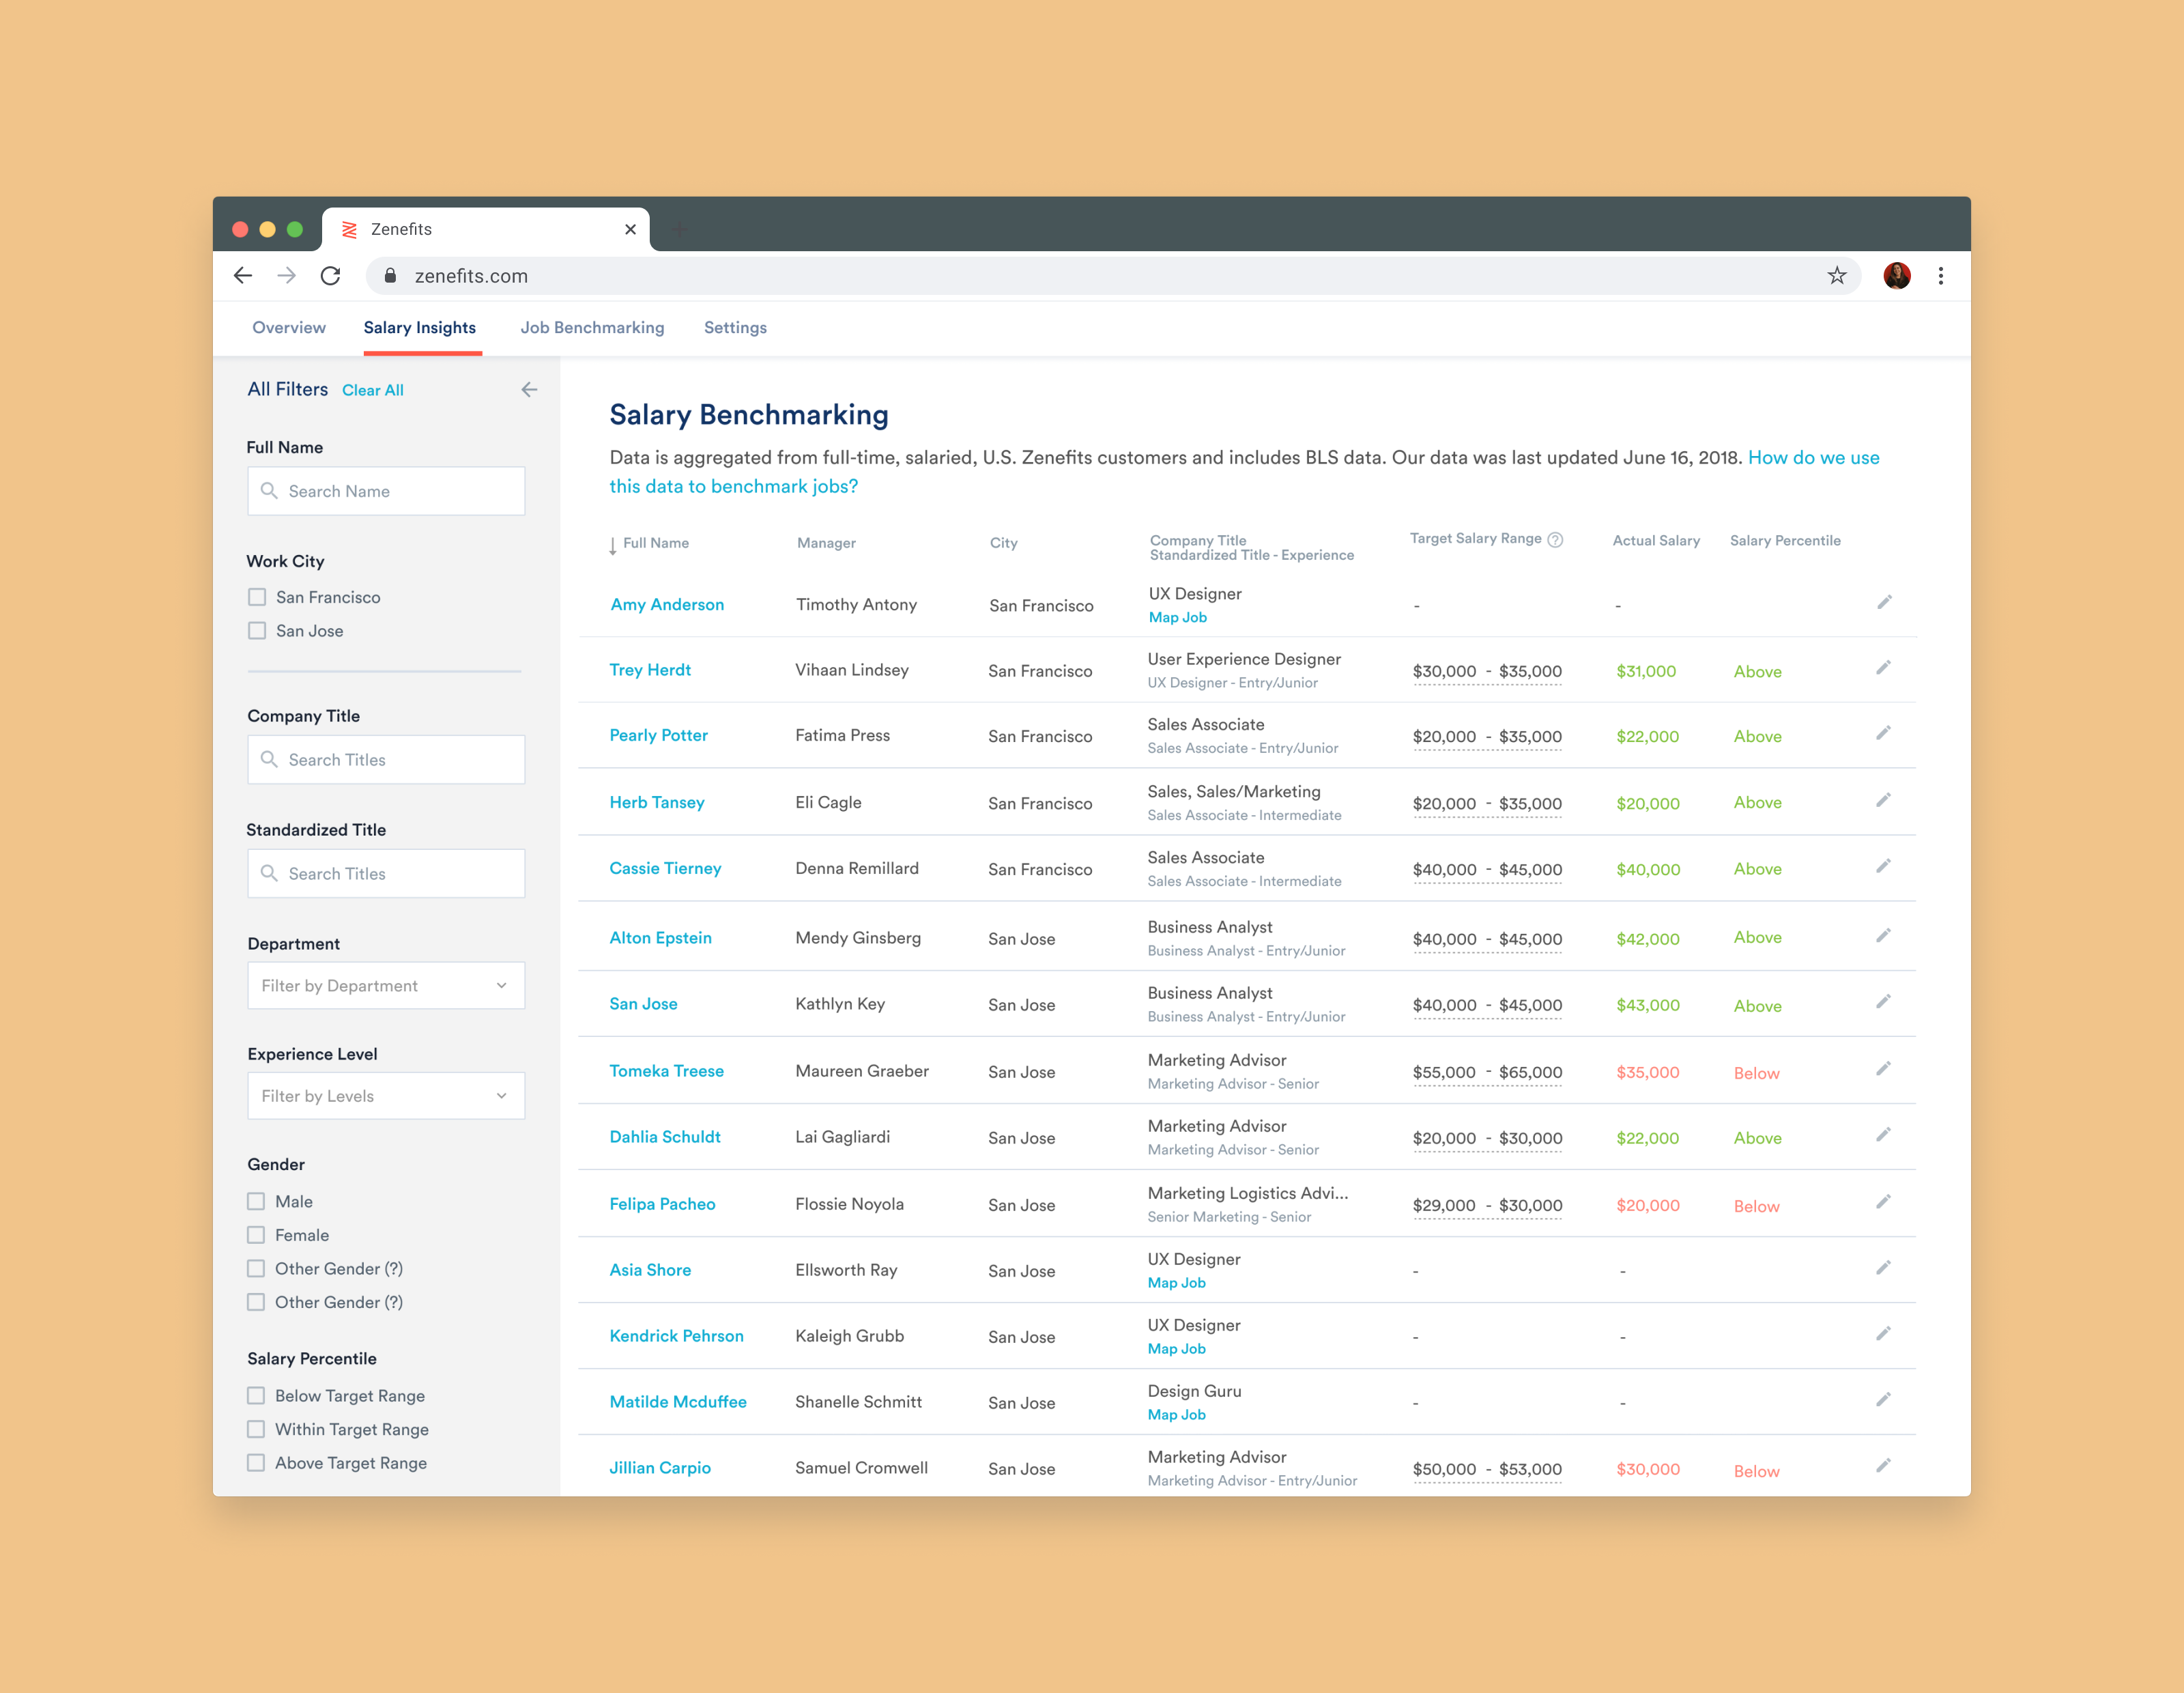
PART 2: SALARY INSIGHTS
Our Salary Insights page allows admins to associate names and managers to job titles within their company and view actual salaries of employees in comparison to target salary ranges. This table is useful for seeing trends within departments, managers, experience levels, genders, or locations.
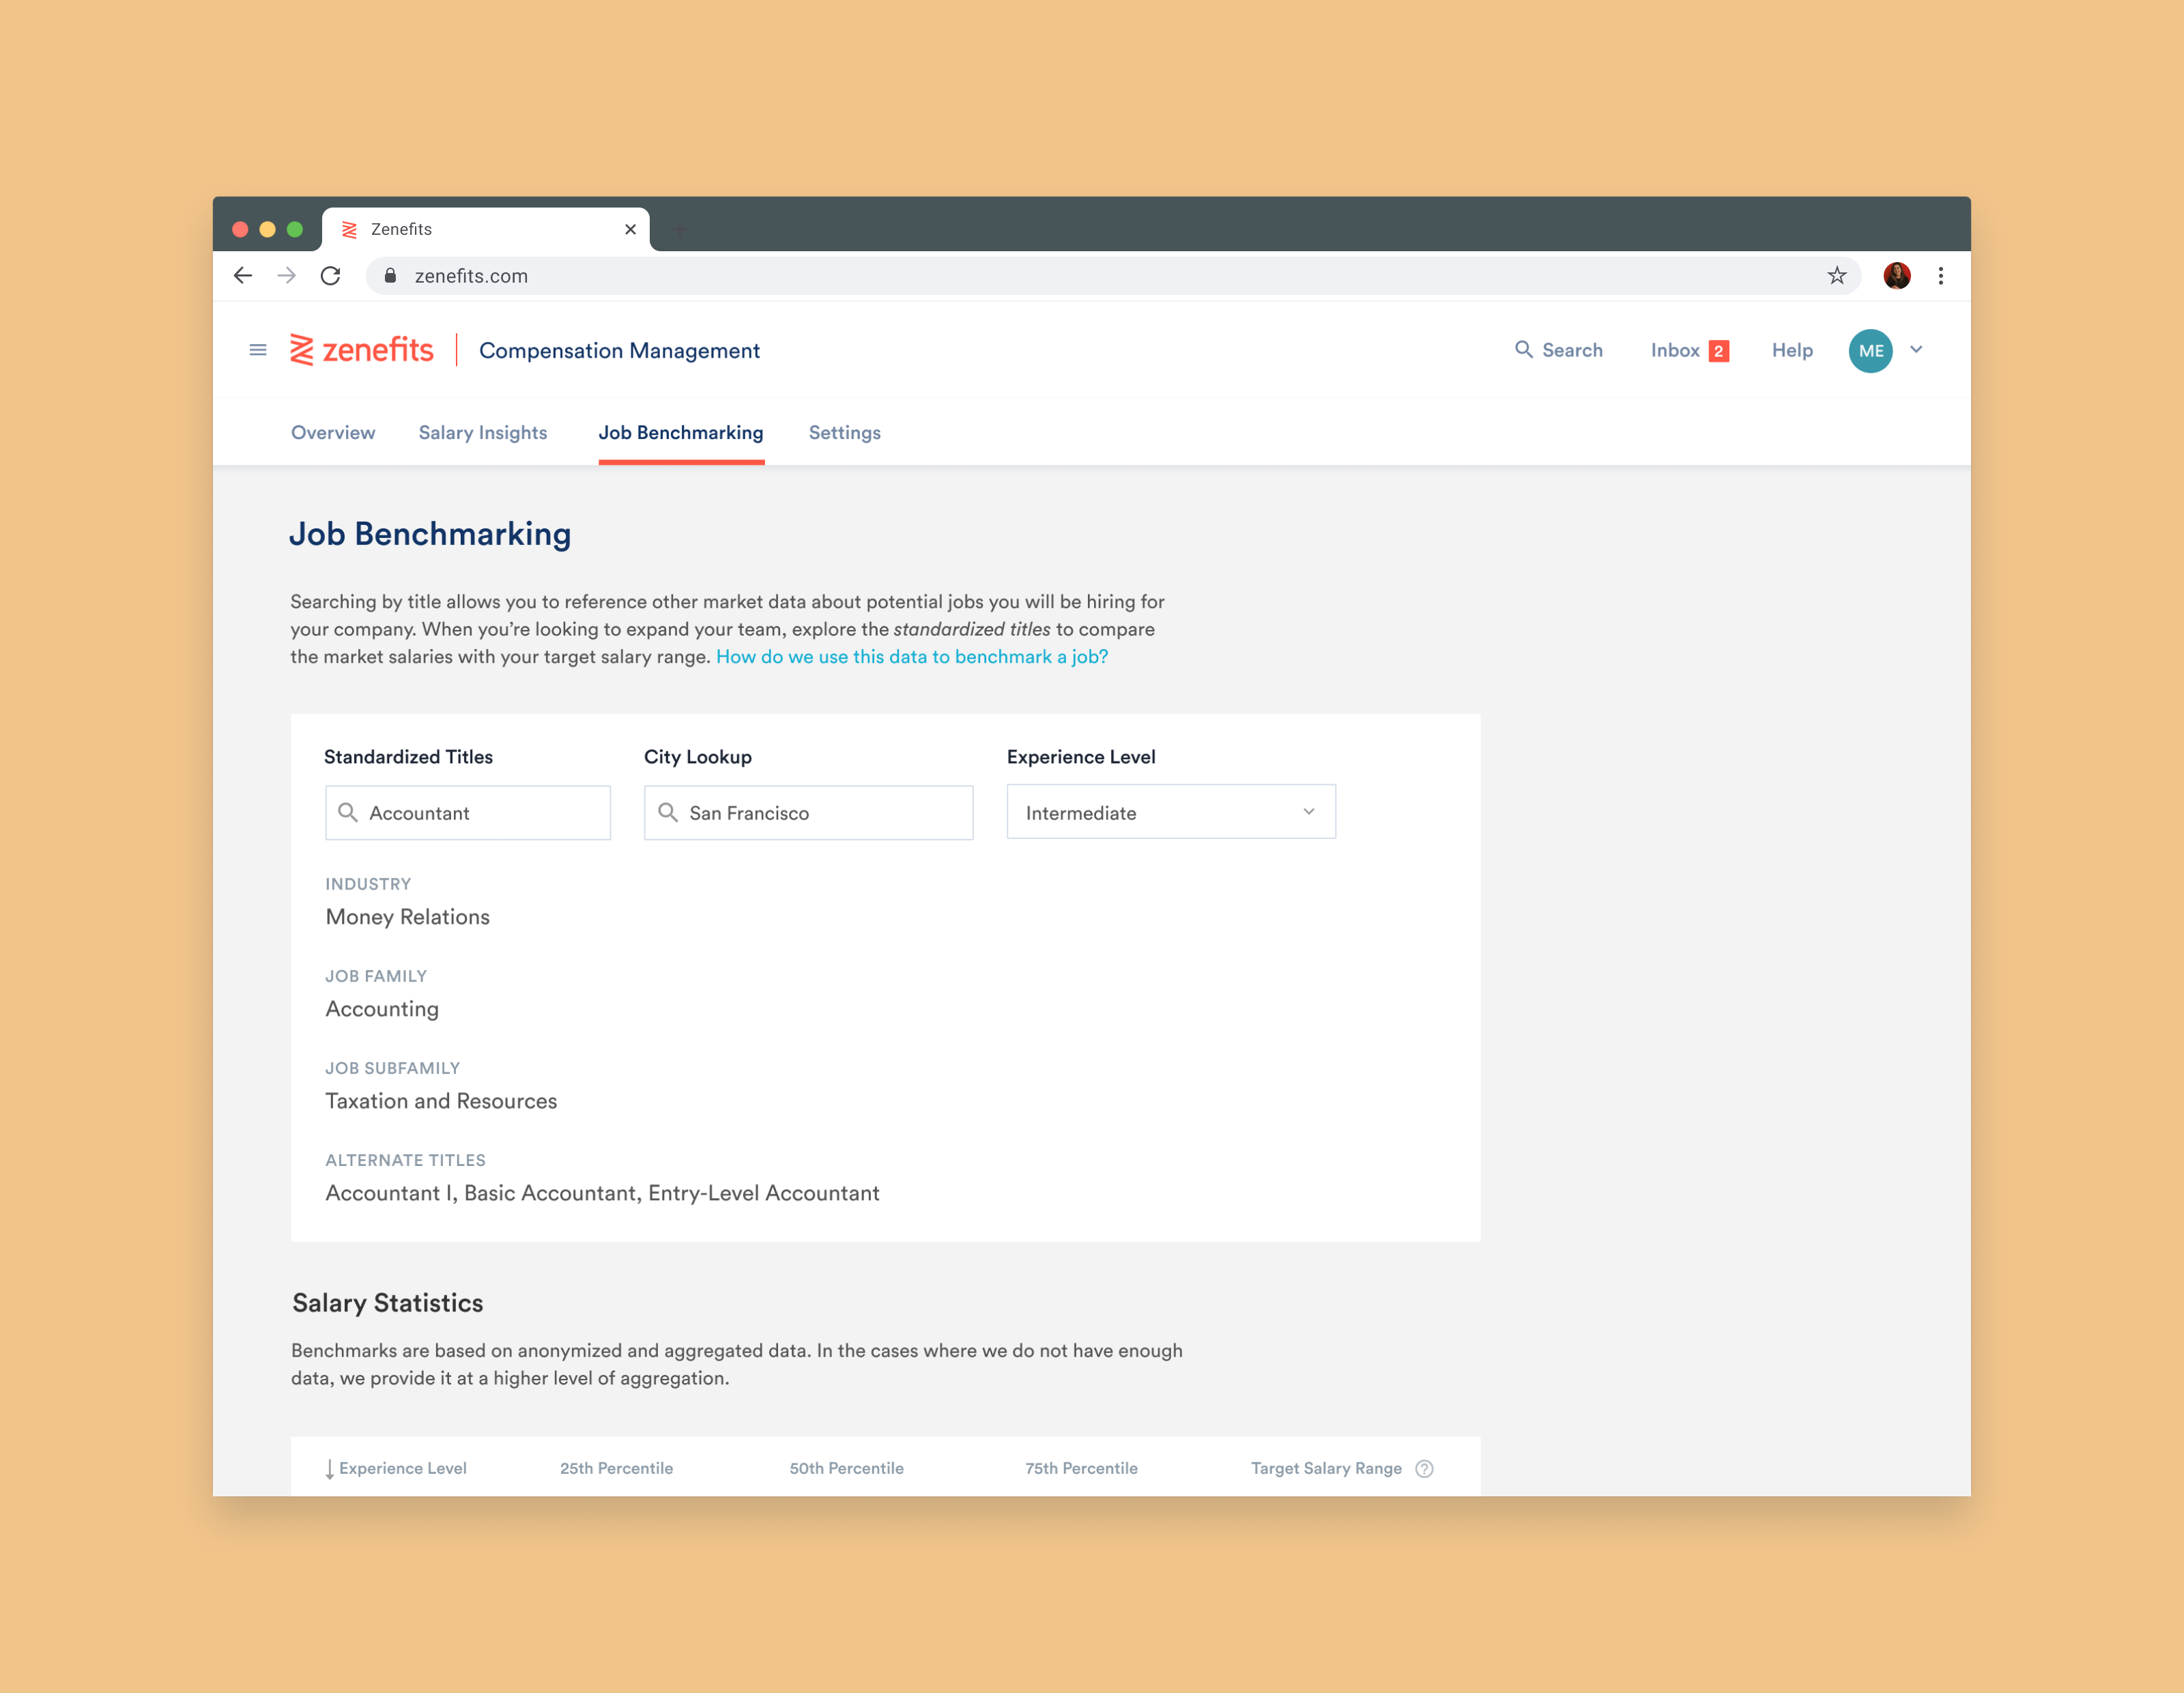
PART 3: JOB BENCHMARKING
When hiring a new employee, we wanted to make sure that admins had the most accurate, relevant data to use to make compensation decisions. The Job Benchmarking page allows them to search for job titles in our Zenefits aggregated database. Admins can cross reference locations and experience levels to find a target salary range for said employee.
FINAL FEATURES: JOB MAPPING
The most interesting part of this project was figuring out the UX for admins mapping jobs within their companies to jobs in the Zenefits aggregated data repository.
This mapping involved 3 "layers" - deciding a position's Job Family (macro industry categorization), Job Sub-Family (more micro industry categorization), and Standardized Title (Zenefits job title). We attempted to explain these concepts through a help article on our website.
Although we ultimately went with simple dropdown selections for our initial release, I concepted this Finder-style layout to create a more dynamic interaction that allowed the user to see all options and selections at once.
JOB MAPPING ITERATION
I was able to come up with 3 different directions for the job mapping:
- The Finder-style concept above for maximum option visibility
- A plain search that allowed for a list of descriptions of jobs to choose from
- A more survey-style option that asked questions related to the job to try to deduce 3 options for matching the job
I believe transparent design is the best design, which is why I still favored the Finder-style design as my final choice.
RESEARCH
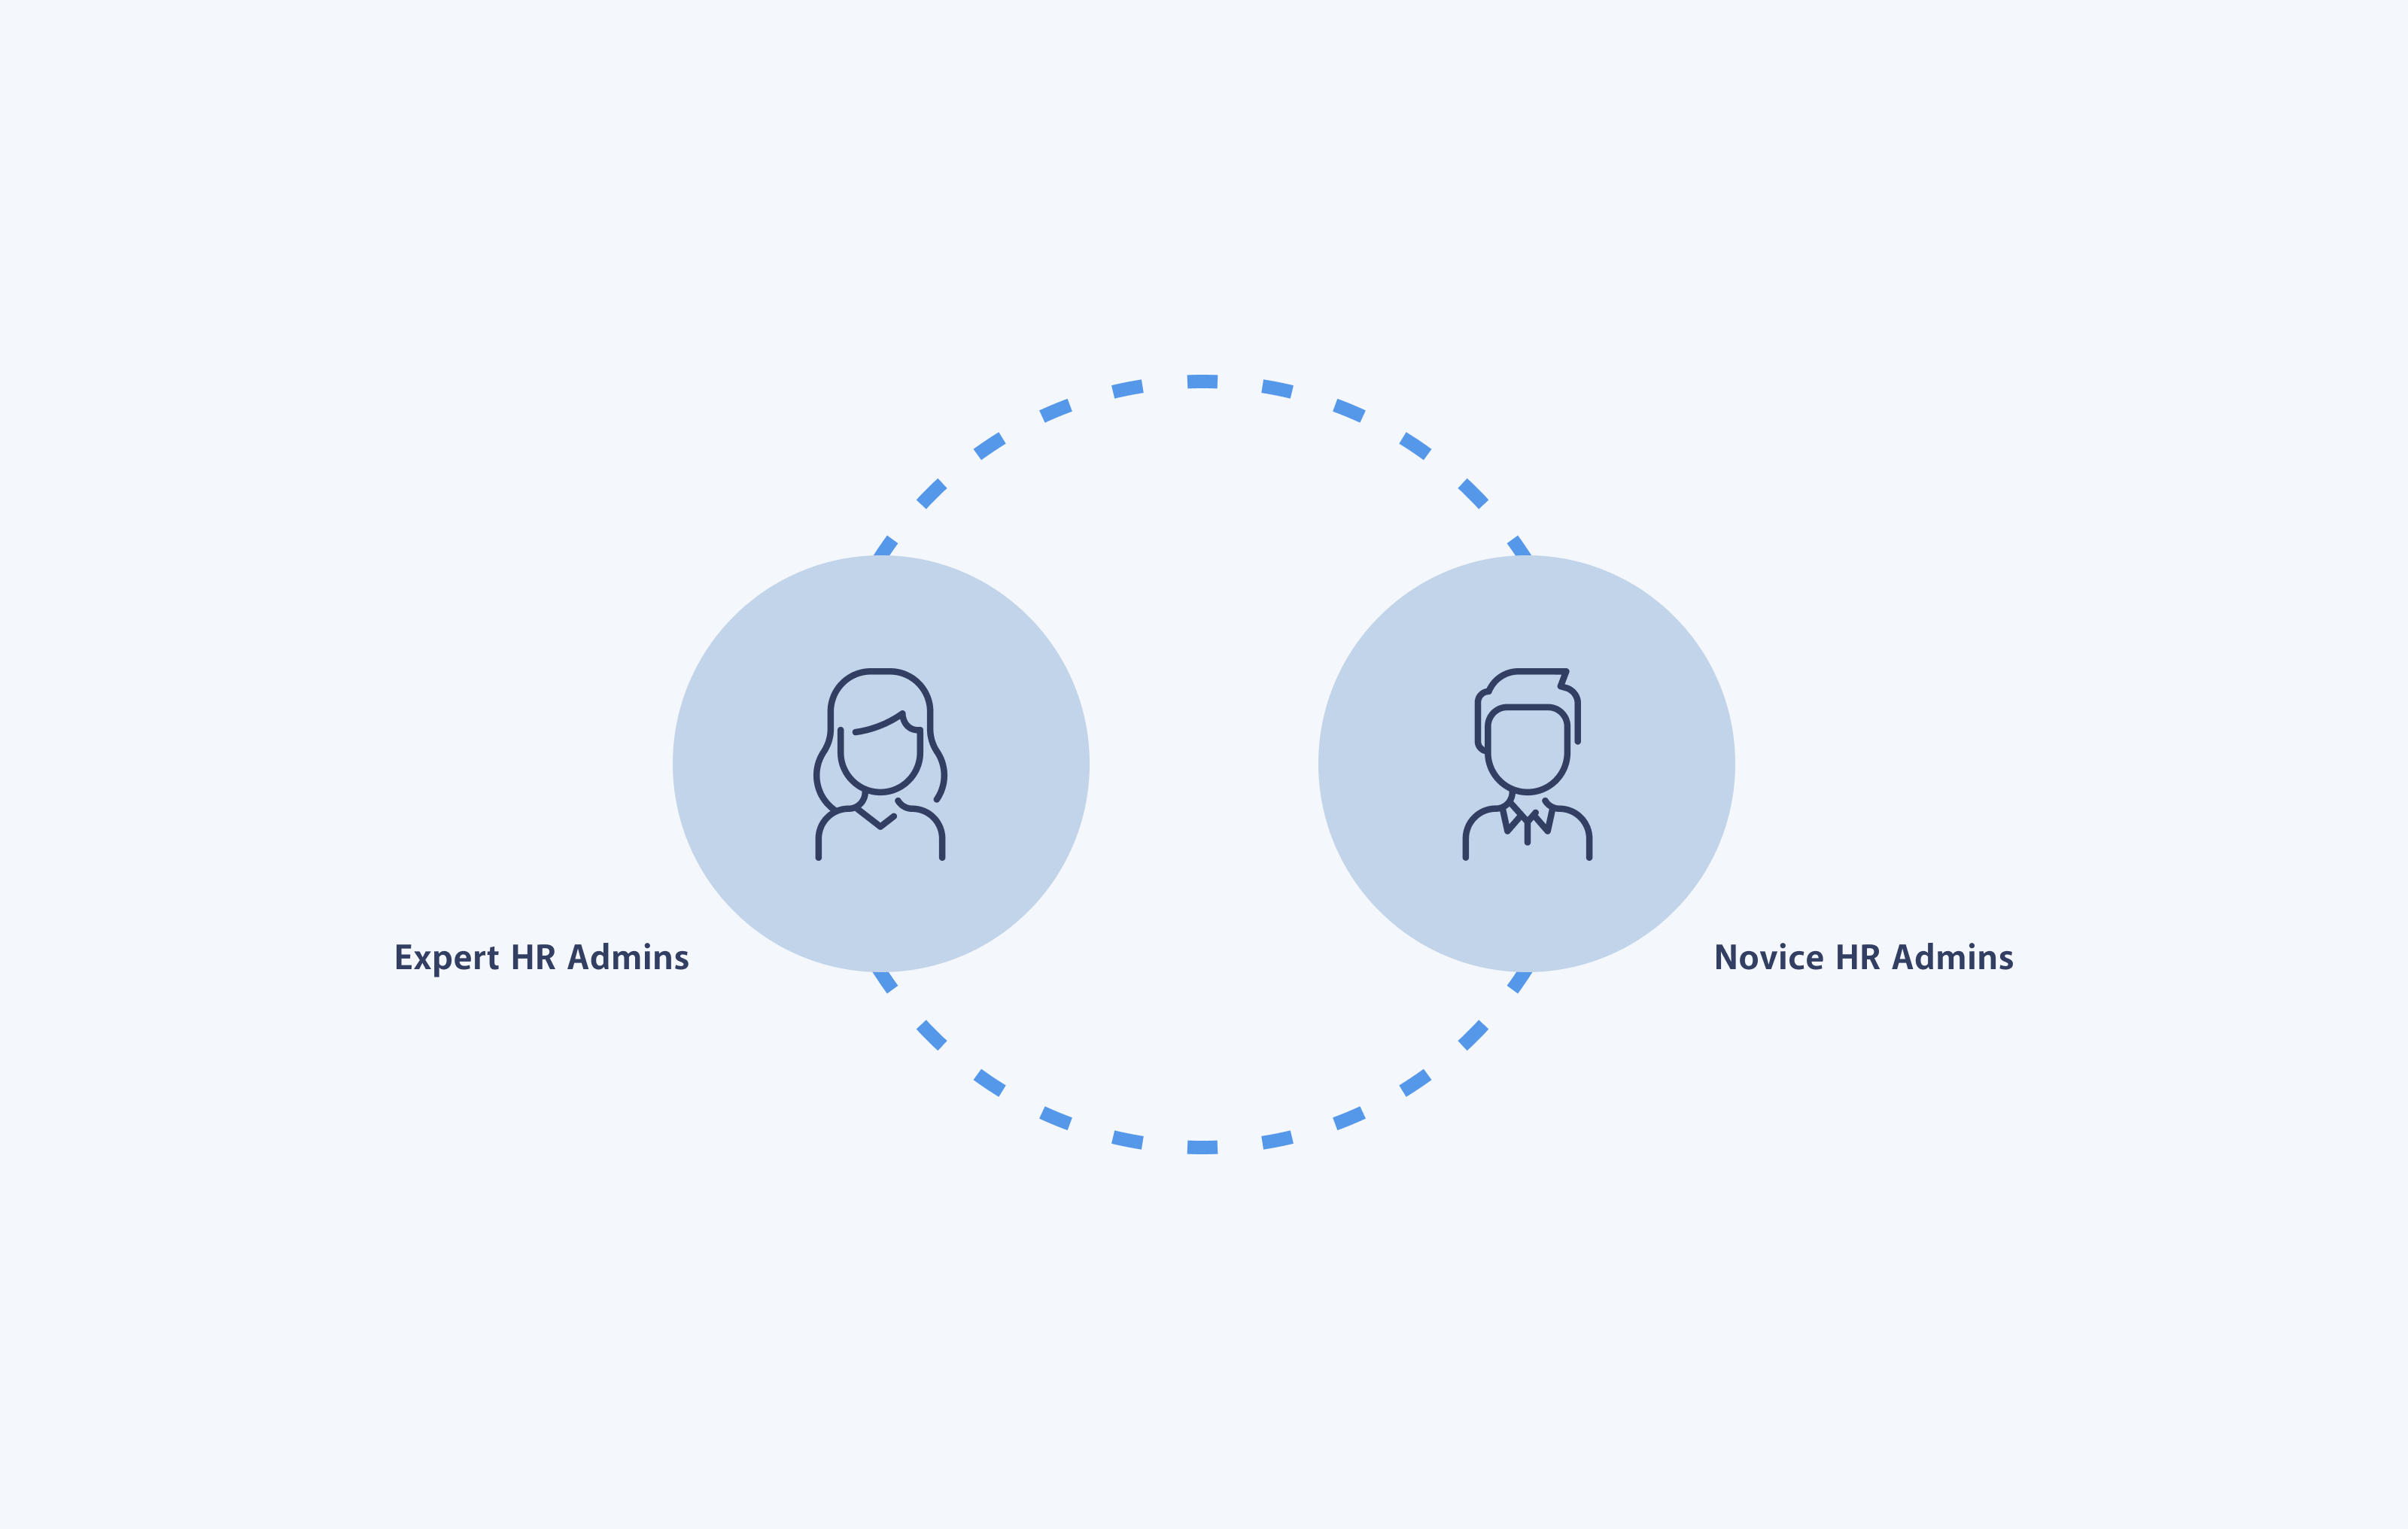
In addition to doing usability testing, our initial research invovled interviewing 12+ company admins, asking them what their process looked like for making compensation decisions for employees, including what resources they utilized to help with these decisions. These emotions and pain points were gathered from both experienced HR admins and more novice individuals:
- Most admins of small-sized business were not confident in the salary decisions they were making
- Most struggled to find salary data related to small-sized businesses like them at an affordable price that fit within their company budget
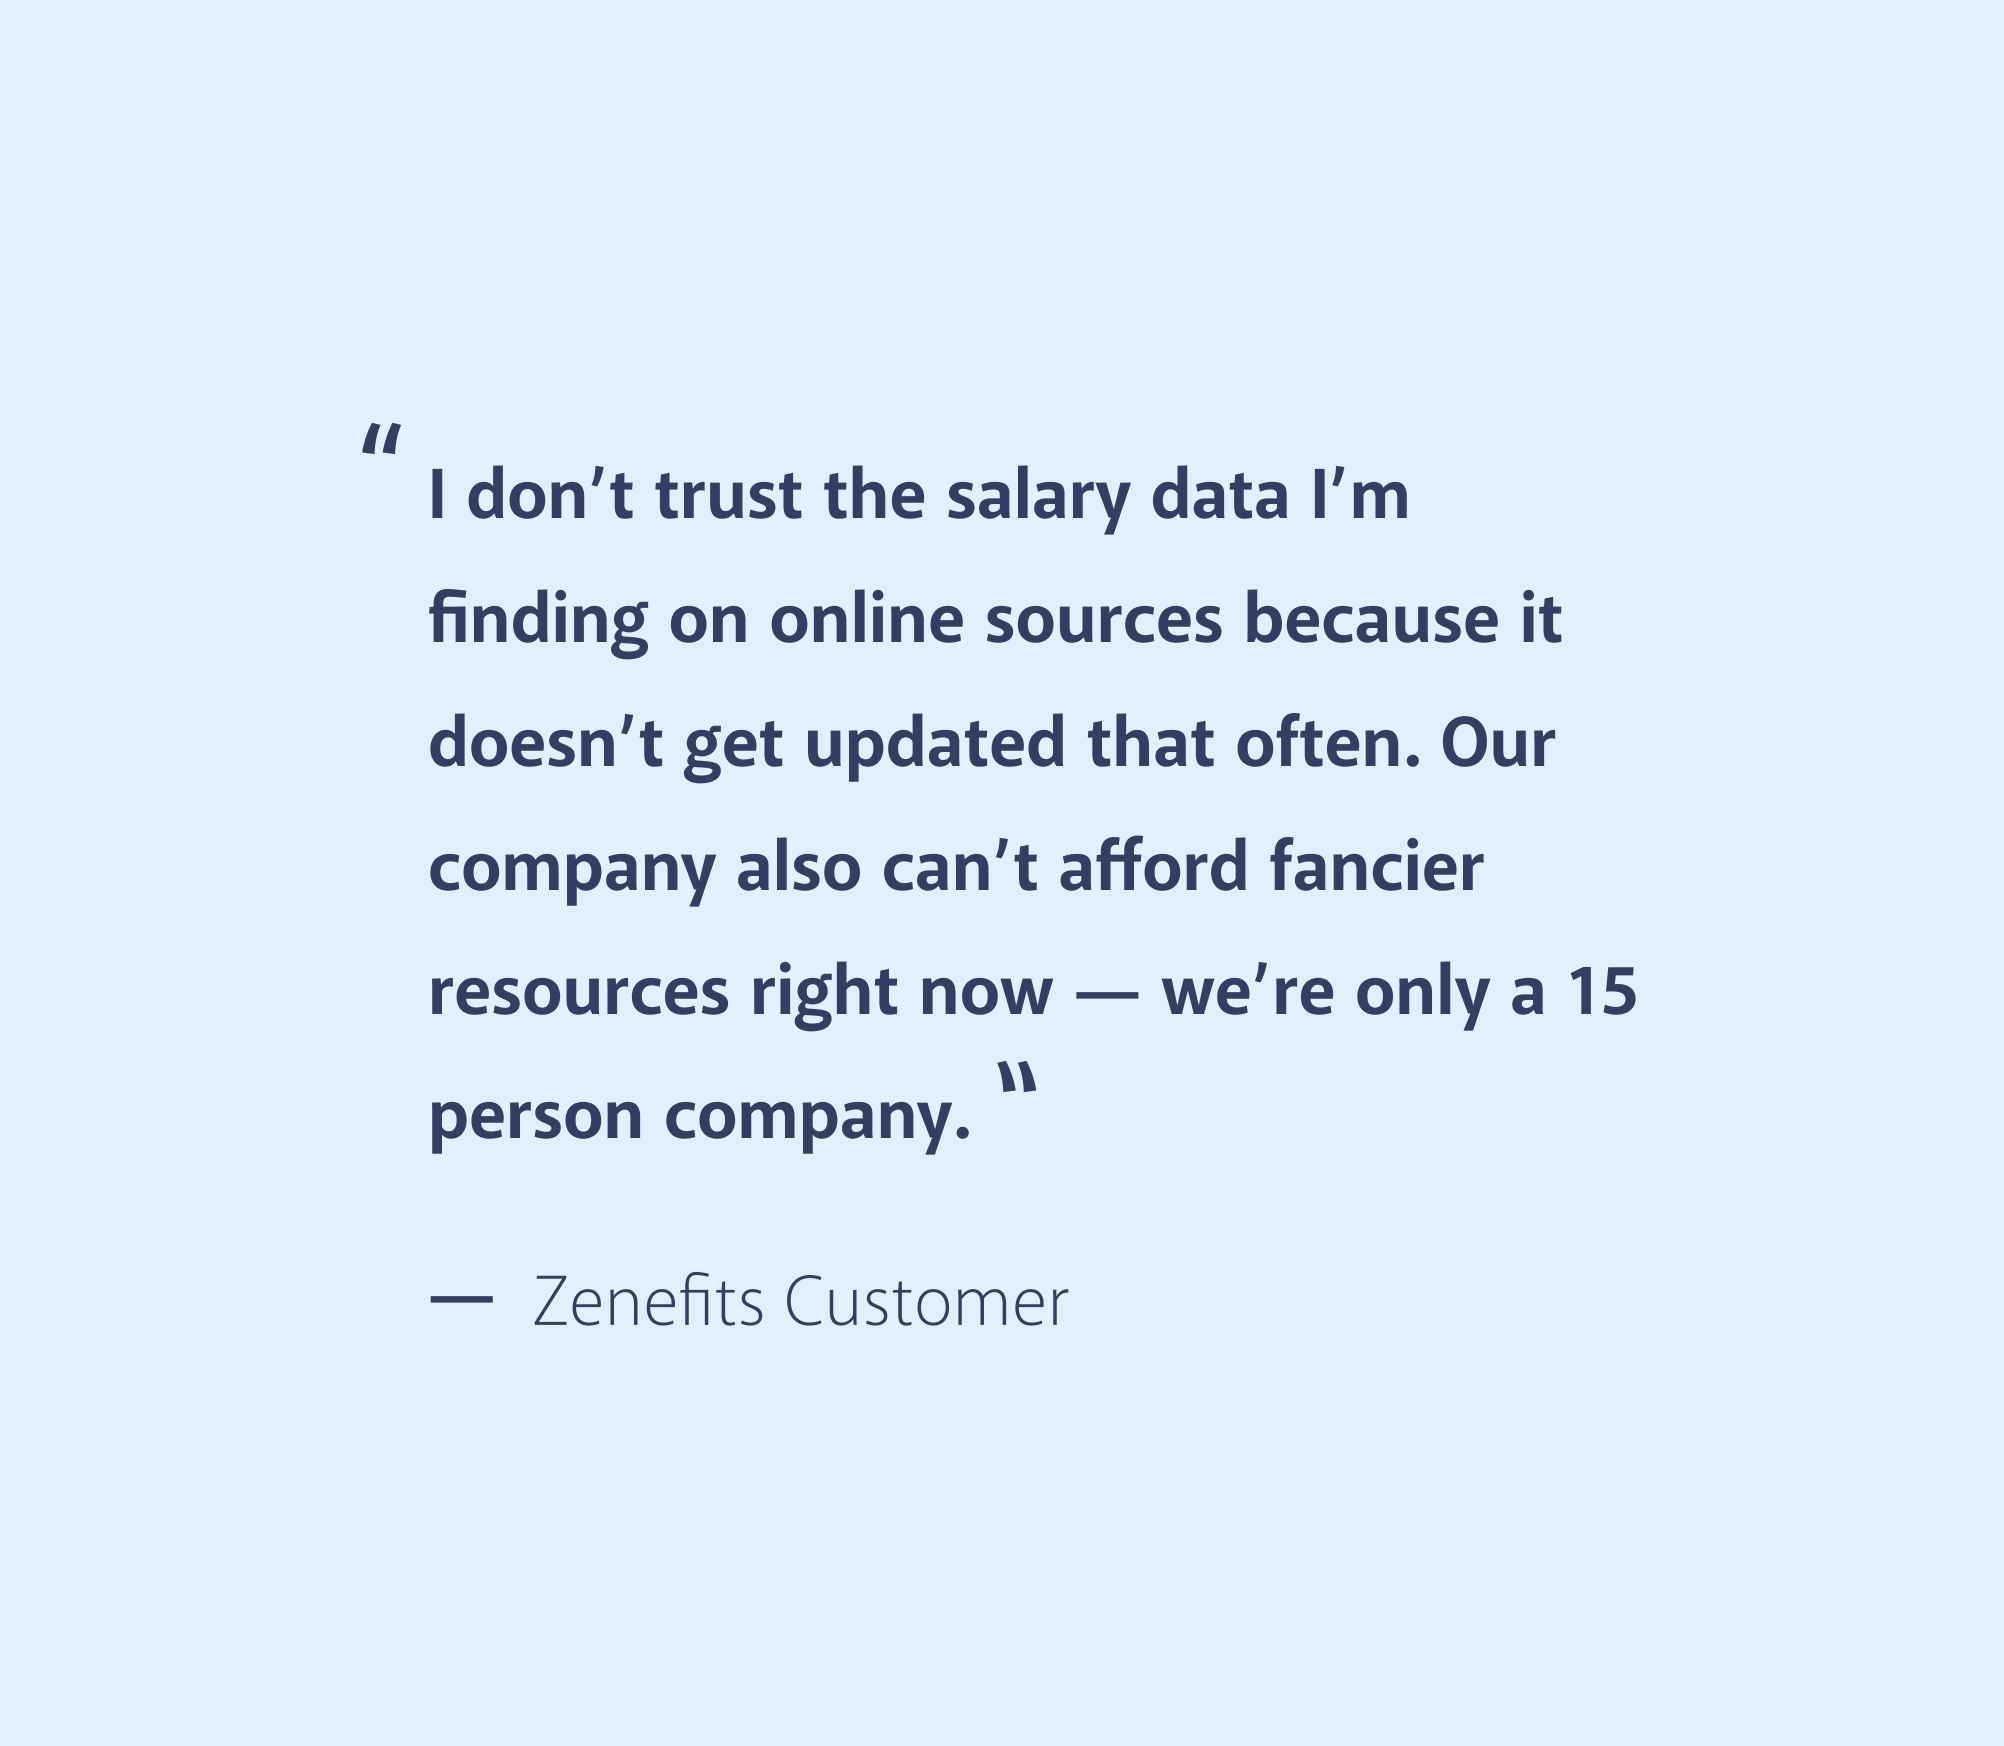
- Some admins were utilizing tools that only refreshed their data every year, so they had a hard time trusting the reliability / accuracy of the data
- Most felt that resources like Glassdoor offered a biased vantage point for salary data because its anonymously provided, sometimes out of spite or bribery for a company
OPPORTUNITY
No other competitors in the small business space had any type of compensation tool with the level of data aggregation that we were able to provide. Other solutions also took days to "map" every employee in a company. We saw this as an opportunity to be a huge differentiator when it came to helping / keeping our current customers, while securing deals with new customers. We wanted them to trust the data that was being provided to them.
DESIGN IDEATION
Our initial research told us that admins wanted a separate app within Zenefits as a tool for compensation aid. In terms of the information hierarchy and features within the app, admins had two main asks that kept repeating:
- I would like a snapshot of my entire company and the salaries of each individual, and to be able to see if I'm paying them accurately.
- When hiring a new employee, I would like to be able to feel more confident in the salary I choose for them based on statistical factors.
These asks translated into the "Salary Insights" and "Job Benchmarking" pages of the application. The Overview page is something I brainstormed and incorporated due to admins consistently mentioning how advantageous it is to see compensation trends within their workplace.
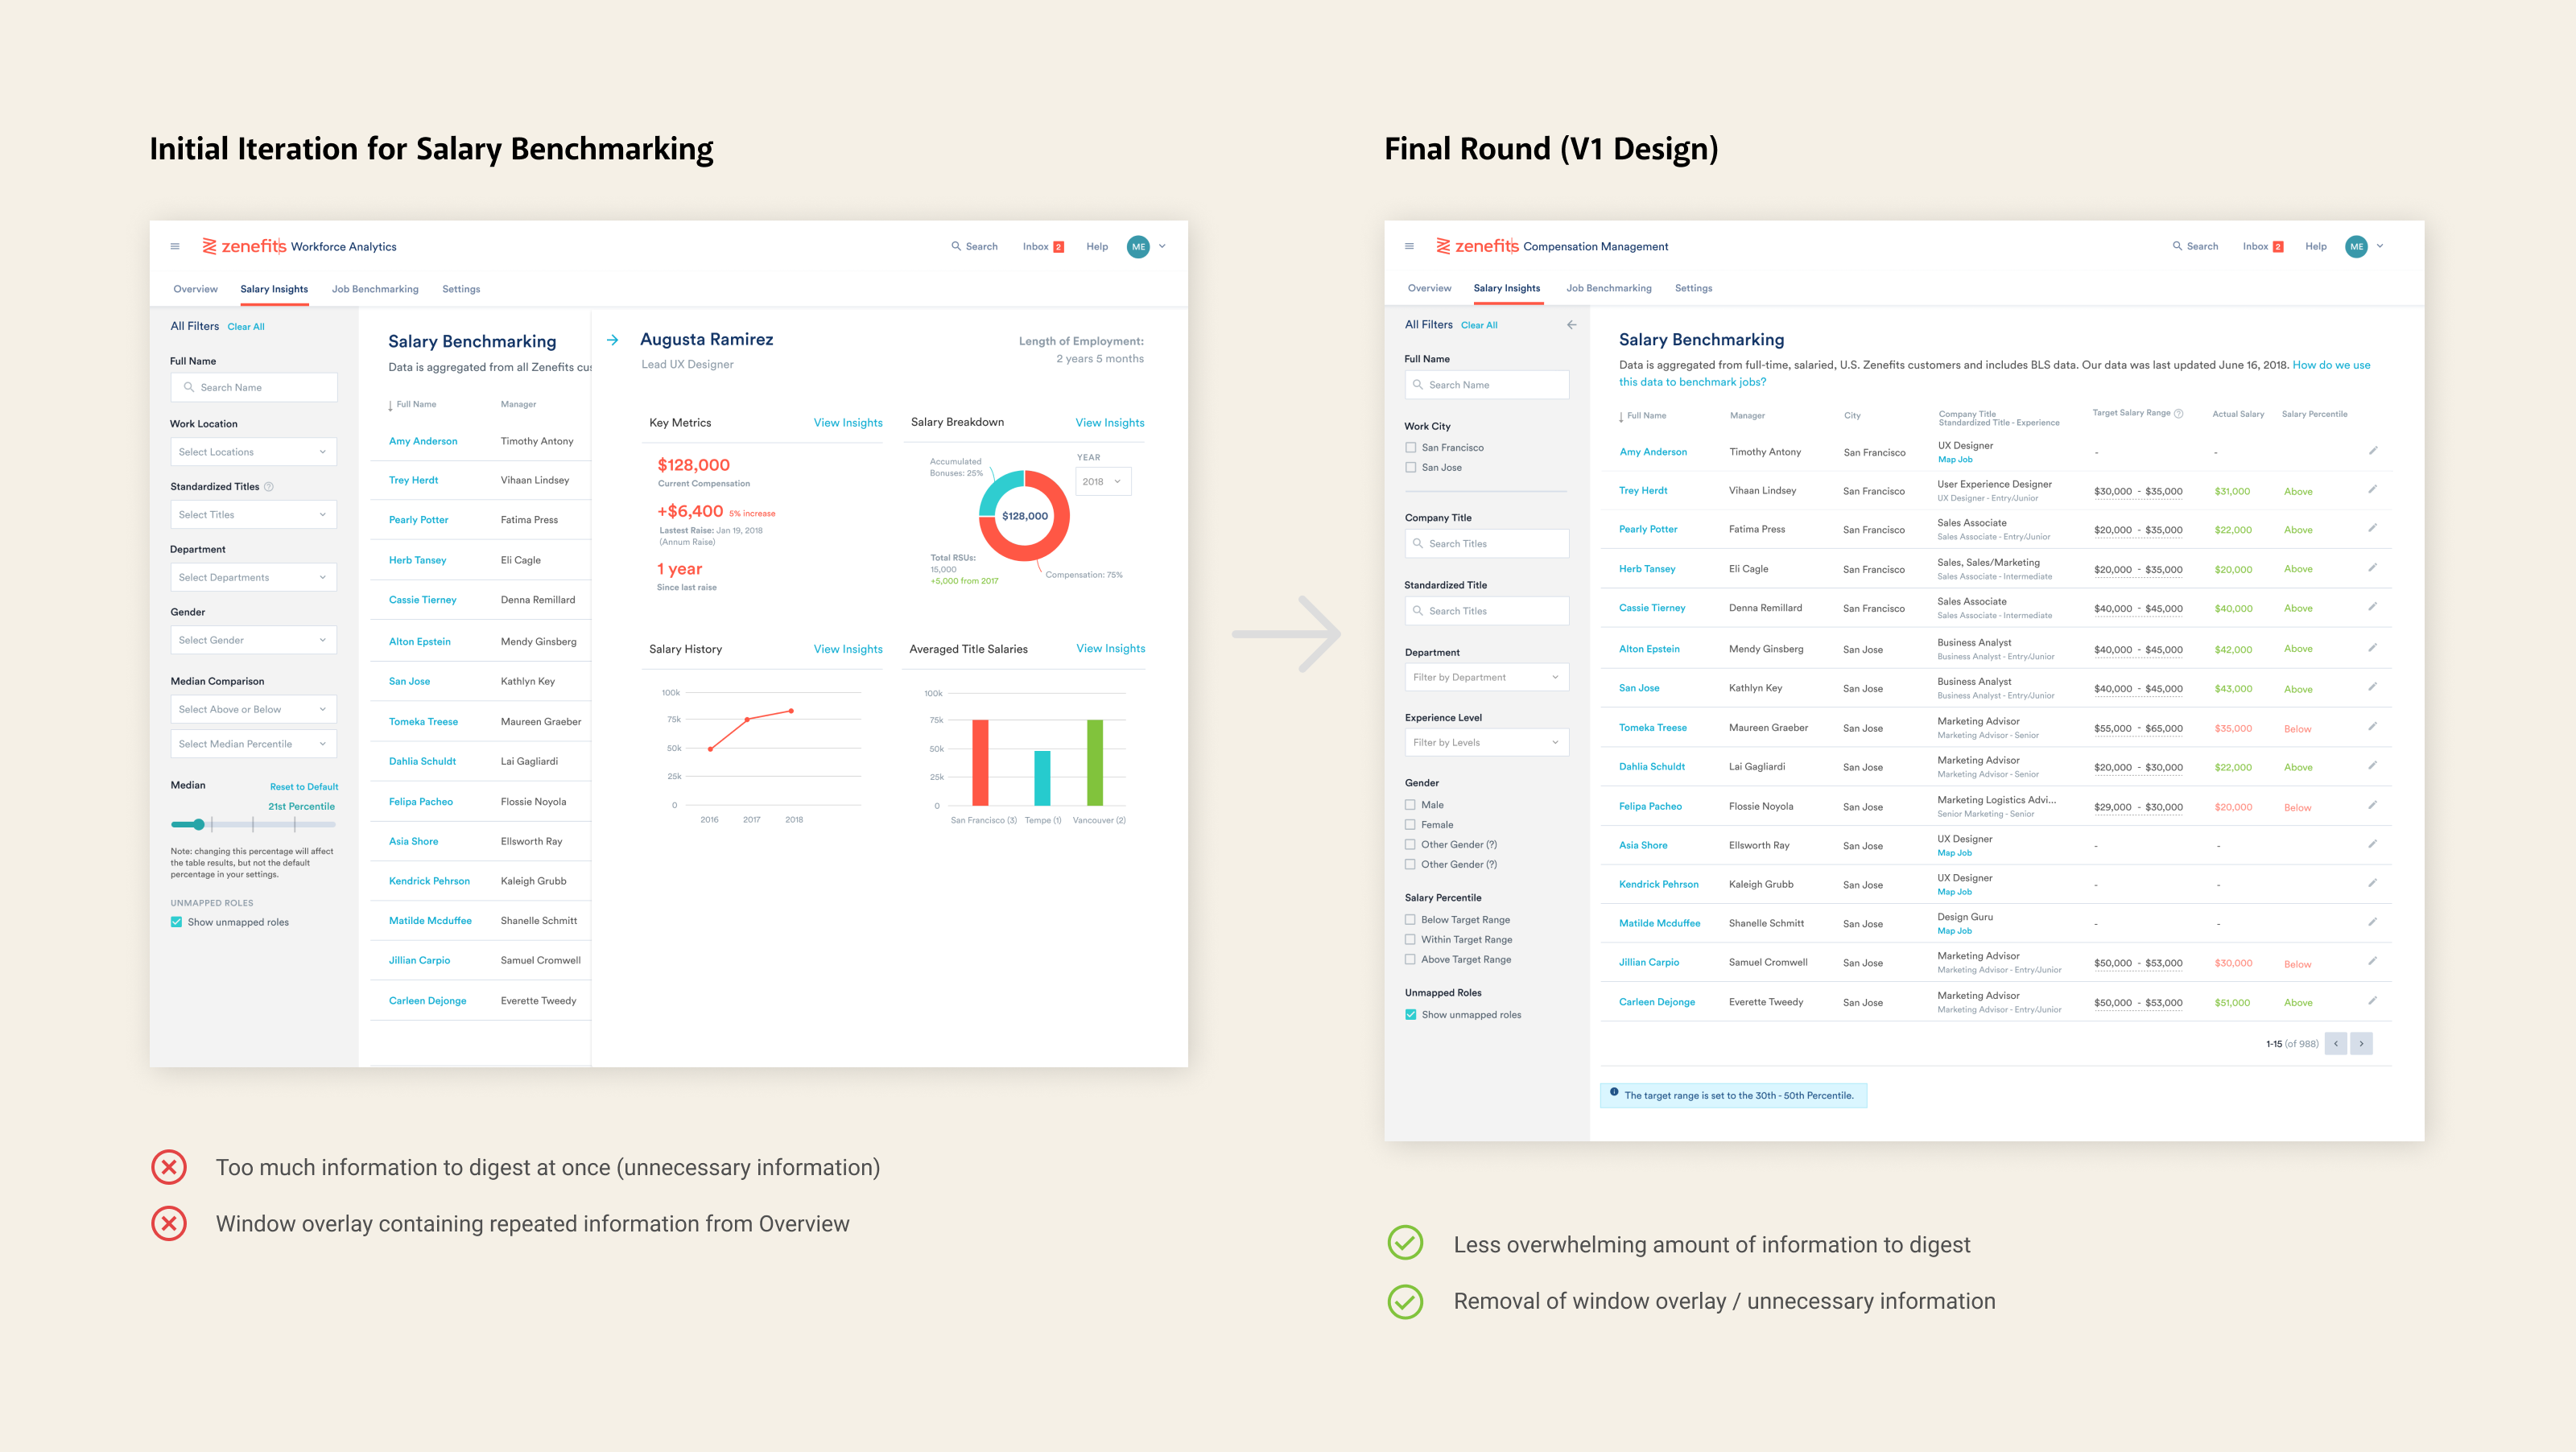
REFINED LAYOUT DESIGN (SALARY BENCHMARKING)
I focused on keeping a complex page already heavy with salary data as intuitive-looking as I could. We removed unnecessary overlays of additional information.
OUTCOME
This project allowed me to do a deep dive into an HR space that I hadn't been exposed to before: compensation planning. Through speaking with users, I was able to empathize more with the challenges that come with being responsible for someone's salary. If I could repeat the process, I would:
- Argue for more say from our copywriter: some of the terminology we use, like job family and job sub-family, is a bit difficult for the users to understand. In future releases we're hoping to change this.
- Stand my ground when it comes to advocating for better UX in the long run: the job-mapping interaction was a long discussion then ended with a dropdown design because of engineering constraints. Good UX requires more time.